
graphs while using ner 1.2 - look and laugh at my server
Page 1 of 1

graphs while using ner 1.2 - look and laugh at my server
![]() ner.d Tue Jun 23, 2009 8:58 am
ner.d Tue Jun 23, 2009 8:58 am
So I keep telling the people at work that the server can't handle the utilization...
Here is the graph from the day while all the users are logged in.. And here is the graph from the backups at night The higher latency image is night.
img1
img2
backups really kill performance but daytime is really bad because too many people are trying to access the server.
[edit]Just so you know that looks good compared to Friday
I will upload more in a few days after I collect more data.
ner.d- Posts : 23
Join date : 2009-06-11
server crashed
![]() ner.d Fri Jul 31, 2009 1:07 am
ner.d Fri Jul 31, 2009 1:07 am
Here is a shot of the file server crash and the same period of time the day before...
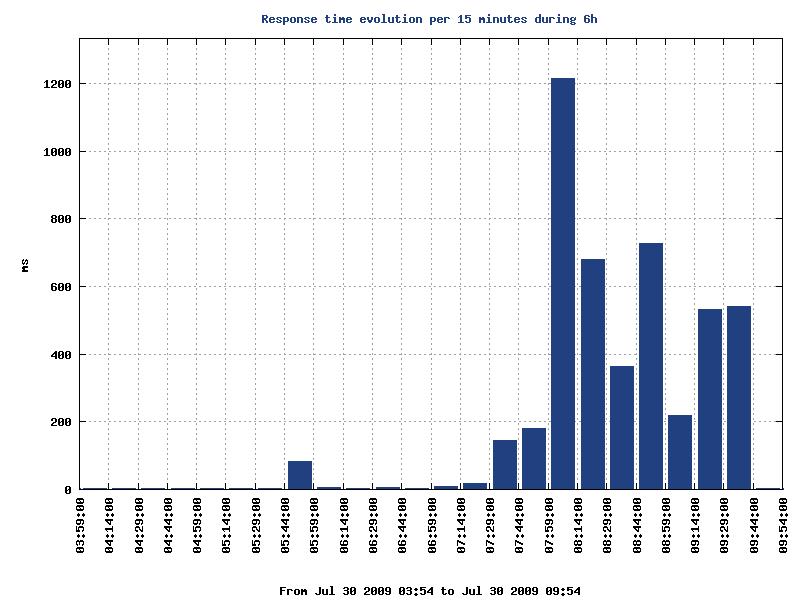

The first one is the crash 1000ms
the day before is normal slow operations 200ms.
Backups were running late on the 29th
The first one is the crash 1000ms
the day before is normal slow operations 200ms.
Backups were running late on the 29th
ner.d- Posts : 23
Join date : 2009-06-11
Page 1 of 1
Permissions in this forum:
You cannot reply to topics in this forum|
|
|